Getting and Interpreting Results
This section covers some of the basic steps of running MCODE on a network.
1. Load Your Network
To begin, load the network to be analyzed into Cytoscape. You can load as many networks as your computer system can handle, large or small.
MCODE will analyze the current network, which is usually the network that is selected in Cytoscape’s Network tab (left-hand panel) or the network View that is currently rendered.
2. Choose The Analysis Options
2.1. Go to the MCODE Panel.
2.2. Click the New Analysis button to open the New Analysis Dialog.
2.3. Choose The Scope:
Clusters can be found in the entire network or from a selection of nodes. Chose one of these options in the Find Clusters section of the New Analysis Dialog:
Find Clusters in Whole Network - MCODE will find and report all clusters in the entire network.
Find Clusters from Selection - Only those clusters which include the selected node(s) within them will be reported. - Selections can be made either directly in the view, the Node Table or Cytoscape’s handy search tools.
Note
The choice of scope is dependent on your familiarity with the network in question and the desired outcome. If you have a particular protein of interest within a network, for example, it may be appropriate to search for only those clusters involving such a protein. On the other hand, exploratory work will benefit most from analyzing the whole network.
3. Analyze Your Network
3.1. Click the Analyze Current Network button:
If everything is OK, this will display a progress meter of the scoring, finding, and drawing steps, provided that the task is not too quick.
However, the analysis cannot be performed in some situations, where you may see these Analysis Interrupted messages:
No Selection Message
This message appears when the From Selection scope is used without an actual node selection.
You must select the desired node(s) and try again before MCODE can attempt to find clusters.
Parameters Unchanged Message
Parameters are discussed in detail in the following section. For now, you should know that if you attempt to analyze a network twice without changing any of the settings, such as the scope of the analysis, MCODE will let you know that this analysis was previously conducted.
4. Browse Your Results
If the analysis finds clusters, the result will be added to MCODE’s main panel as
result_number - network_name(e.g. “1 - galFiltered.sif”).
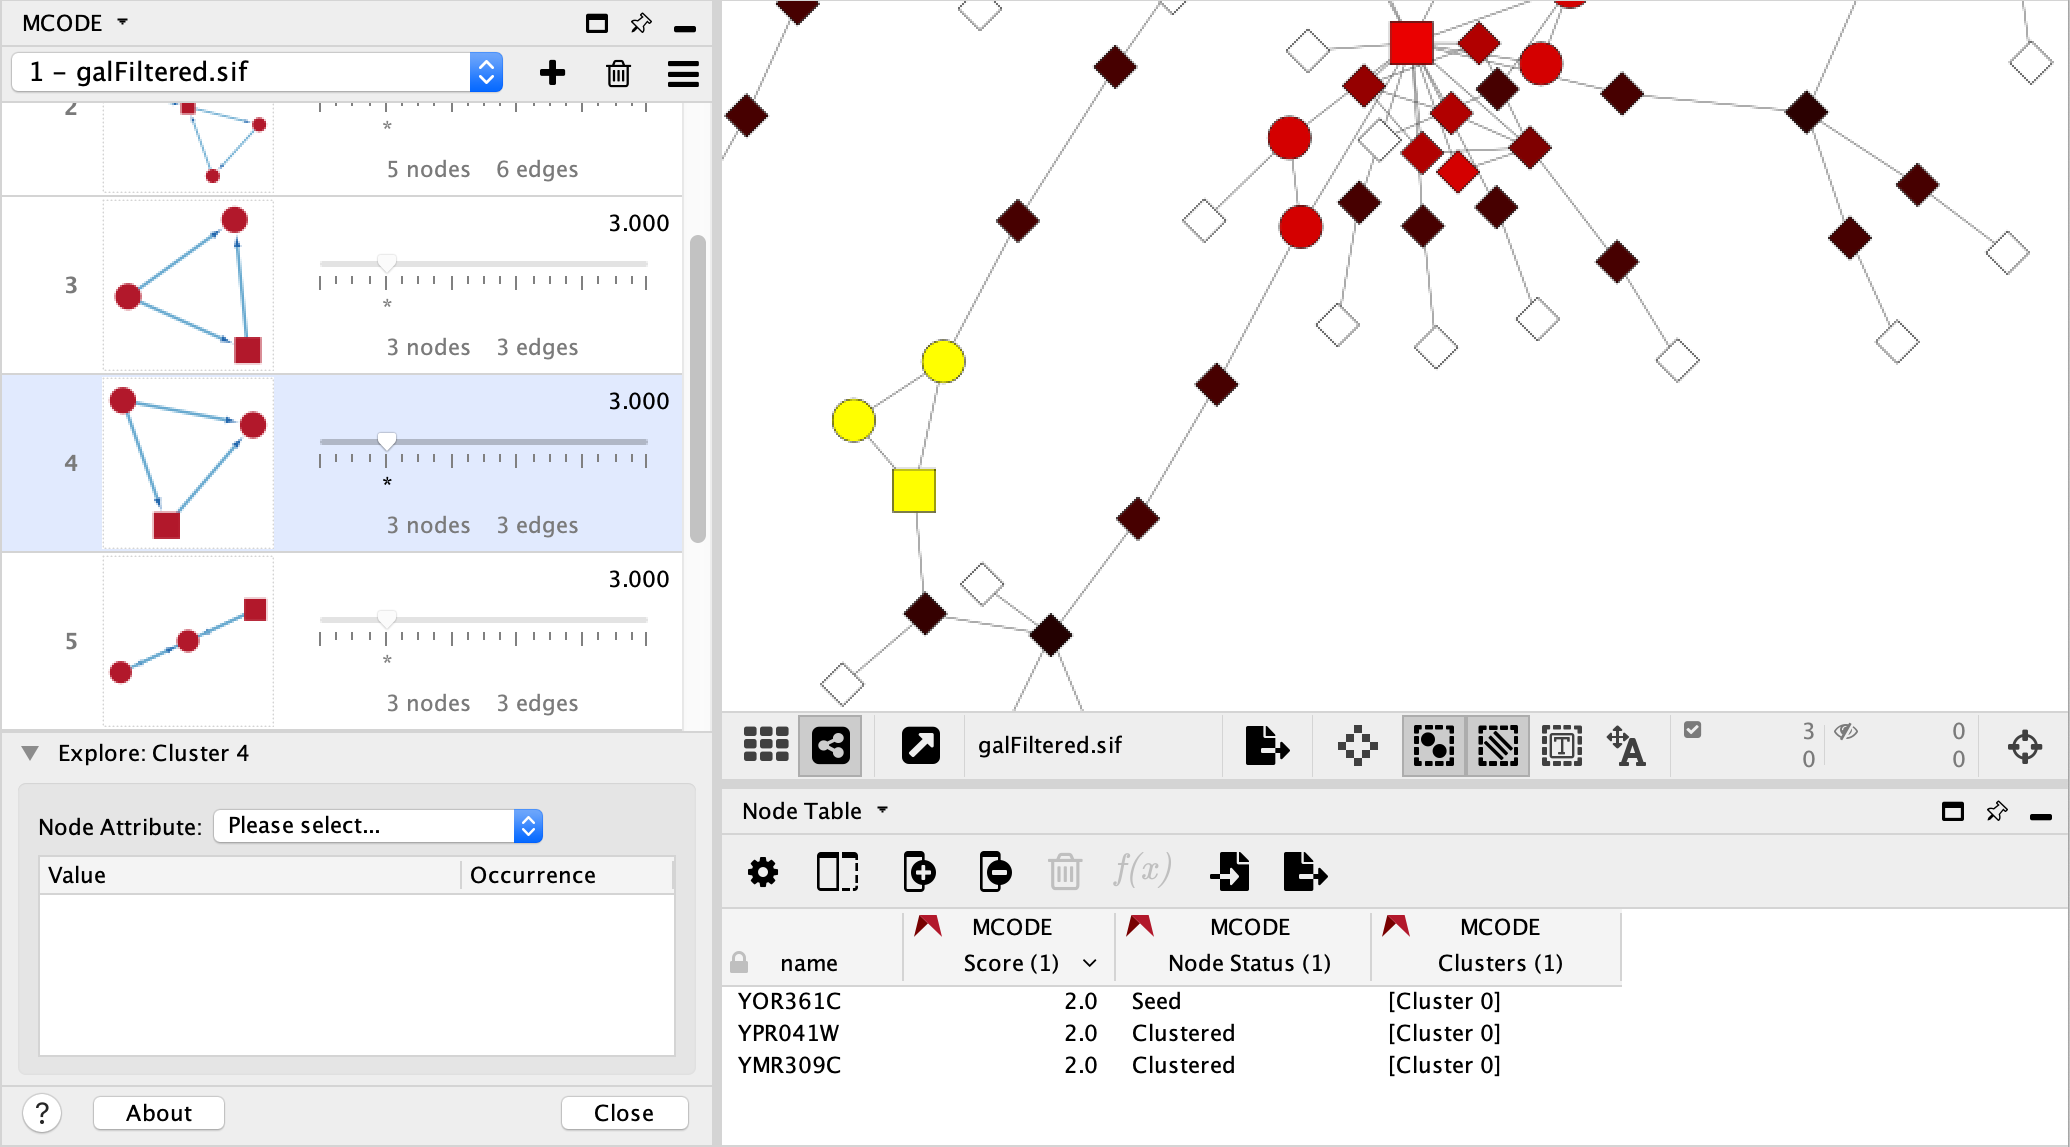
4.1 Cluster Browser
The Cluster Browser entries are ordered from highest to lowest cluster’s computed score:
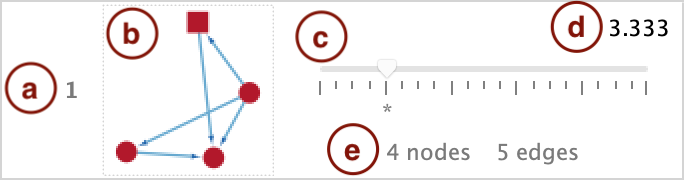
Rank: Just a number based on the cluster’s computed score, used to identify the clusters within each result.
For example, Cluster 1 is the highest ranked cluster in a given result, and thus, at the top of the list.
Cluster: The graphical representation of the cluster.
Cluster members are coloured red.
The highest scoring node in the cluster is called the Seed. It is the node from which the cluster was derived and is represented as a square.
Other cluster members are circles.
Edges, representing interactions for example, are blue.
Edge directionality is represented by arrows.
Size Threshold: Slider that allows you to expand or reduce the cluster based on the node score.
Score: The cluster’s computed score.
Nodes and Edges: A simple enumeration of the cluster’s members and their interconnections.
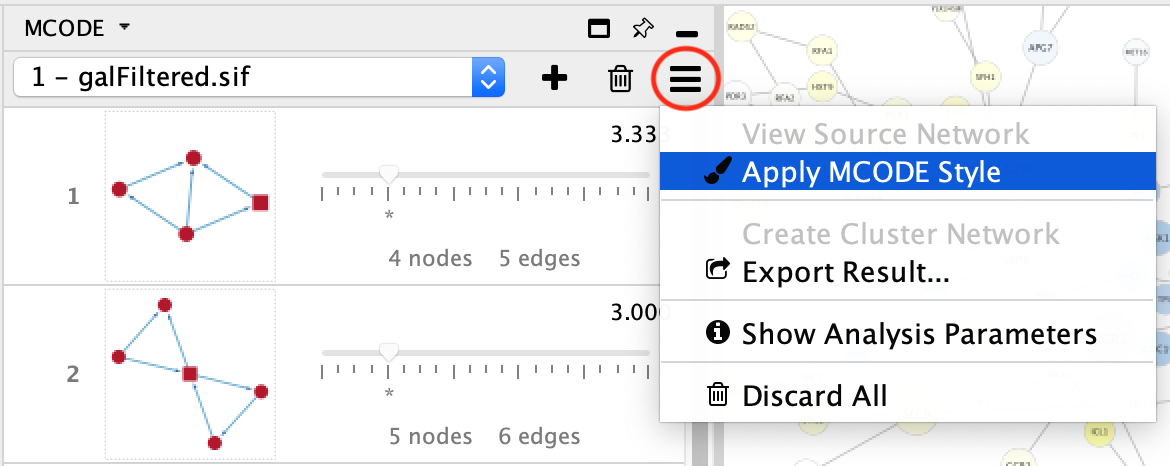
4.2. Network View
If the network being analyzed has a view, you can apply the MCODE Style by clicking MCODE’s Options button and selecting the corresponding menu item.
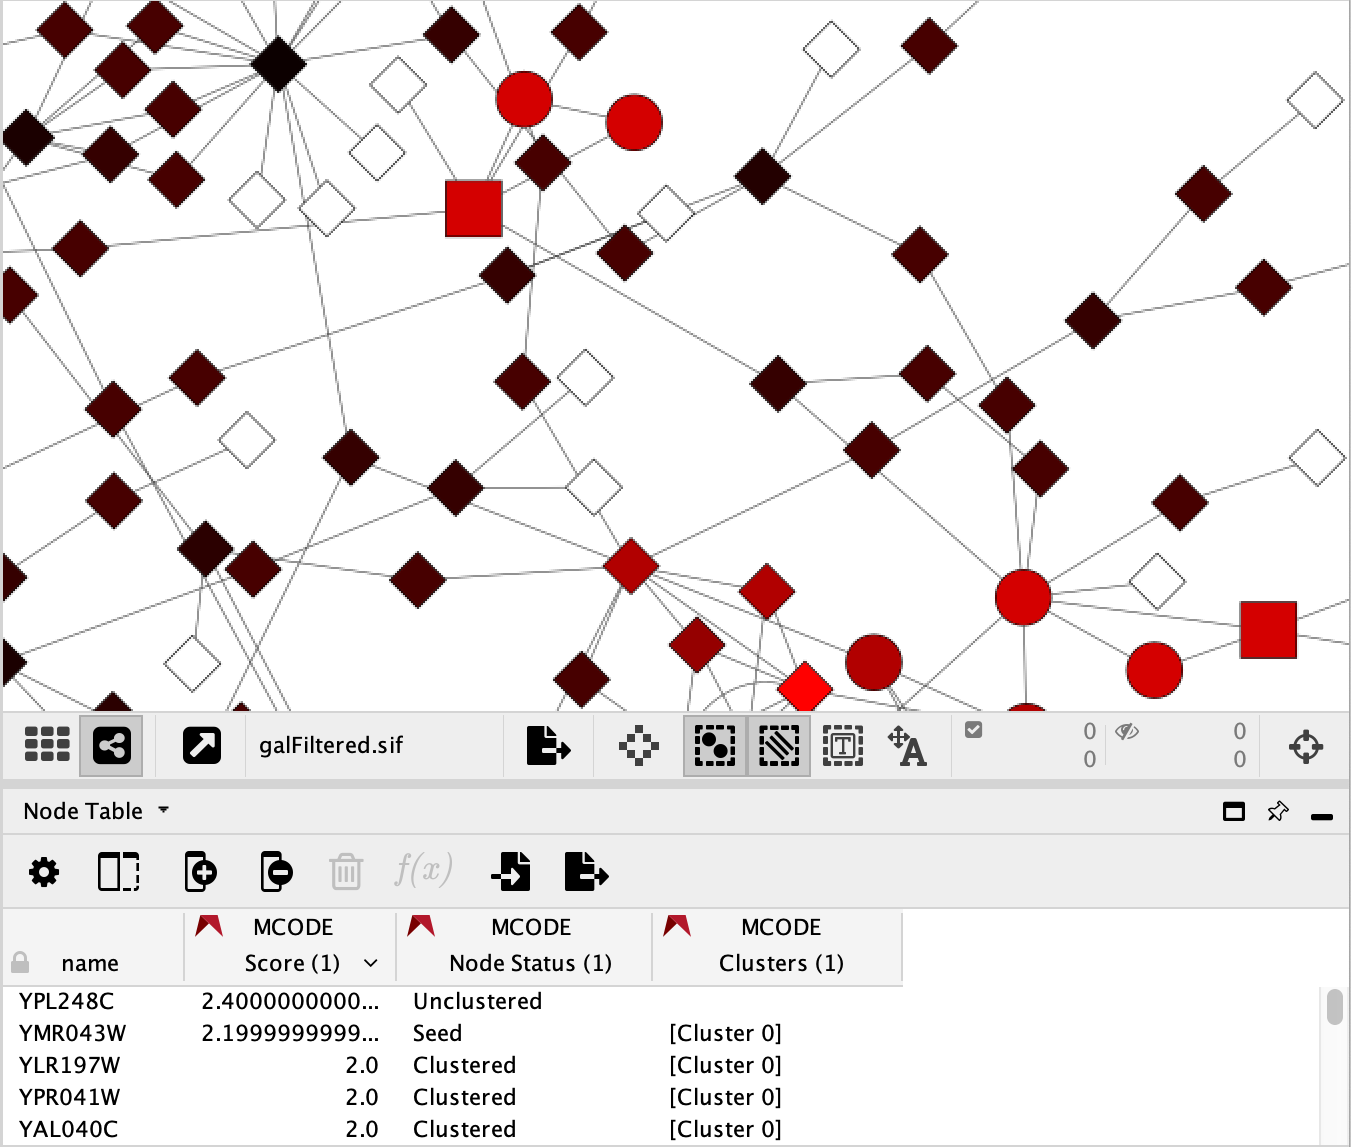
This style utilizes two MCODE generated Node columns:
Node Status: Node shapes indicate the cluster status of the nodes.
Square: seed (highest scoring node in the cluster)
Circle: clustered
Diamond: unclustered
Score: Node colors represent the node score.
A range from black to red indicates the MCODE computed node score (lowest to highest, respectively).
White indicates a score of zero.
Note
The Clusters column is an additional list type attribute that indicates which cluster the node belongs to. The MCODE Style does not use this column, but it exists should you need it.
4.3. Cluster Selection
The cluster entries in the Cluster Browser are selectable and will automatically select the corresponding nodes in the network view (if it exists). If no network view is available, the selected nodes can be reviewed in Cytoscape’s Node Table.
Also, the cluster exploration panel will appear below the cluster entries titled “Explore: Cluster [Rank]”. This panel can be collapsed for now – its use will be discussed in the Fine-Tuning Your Analysis section of this Manual.